Model Outputs#
UM outputs are written out in a propriotary format called ‘fieldsfile’, a description of which is in UMDP F03. The primary libraries for working with these files are Iris and Mule.
Variables within a UM file are referred to by STASH code. STASH codes are split up into several different ‘sections’, for instance prognostic variables that the model is actually simulating are all in section 0. Codes can be referred to in a format like m01s03i236 for section 3 item 236 (the m part is a legacy attribute and is always 01), or as an integer s*1000 + i like 3236.
Output from Aus2200 is based upon BARRA’s output fields. Output is split into the following streams:
cldrad: Cloud, precipitation and radar
mdl: Wind, temperature, pressure
slv: Surface variables
spec: Surface variables
Iris#
Iris is a high-level library for working with climate and weather data, and includes fieldsfile support.
https://scitools-iris.readthedocs.io/en/stable/
import iris

# Load a single 'cube' from the file by stash code
cube = iris.load_cube('~/cylc-run/u-cy369/share/cycle/20200120T0000Z/aus2200/d0198/RA3/um/umnsaa_pvera000', 'm01s03i236')
cube
| Air Temperature (K) | time | latitude | longitude |
|---|---|---|---|
| Shape | 7 | 450 | 450 |
| Dimension coordinates | |||
| time | x | - | - |
| latitude | - | x | - |
| longitude | - | - | x |
| Auxiliary coordinates | |||
| forecast_period | x | - | - |
| Scalar coordinates | |||
| forecast_reference_time | 2020-01-19 18:00:00 | ||
| height | 1.5 m | ||
| Attributes | |||
| STASH | m01s03i236 | ||
| source | 'Data from Met Office Unified Model' | ||
| um_version | '12.2' | ||
import iris.plot as iplt
import matplotlib.pyplot as plt

# Iris cube has metadata for dimensions that gets used when plotting
iplt.contourf(cube[0,:,:])
plt.gca().coastlines();

Mule#
Mule is a low-level library for working with UM related files, including fieldsfile, ancil files and PP files. Mule lets you directly look at the 2d slices stored in the file, it does not aggregate them into full fields.
https://code.metoffice.gov.uk/doc/um/mule/latest/
import os
import mule

os.environ['UMDIR'] = '/g/data/access/umdir'
mf = mule.load_umfile(os.path.expanduser('~/cylc-run/u-cy369/share/cycle/20200120T0000Z/aus2200/d0198/RA3/um/umnsaa_pvera000'))

for f in mf.fields:
    if f.lbuser4 == 3236: # Stash code for 1.5m temperature
        data = f.get_data() # 2d lat-lon slice of the data
        # See UMDP F03 for the list of field attributes
        break

# Mule just returns a numpy array, there is no metadata
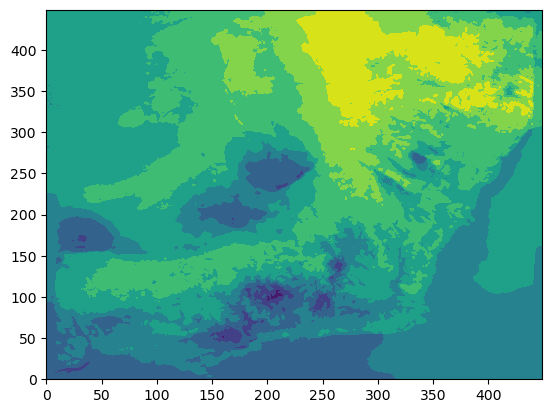
plt.contourf(data);
/g/data/hh5/public/apps/miniconda3/envs/analysis3-23.01/lib/python3.9/site-packages/mule/stashmaster.py:259: UserWarning:
Unable to load STASHmaster from version string, path does not exist
Path: /g/data/access/umdir/vn12.2/ctldata/STASHmaster/STASHmaster_A
Please check that the value of mule.stashmaster.STASHMASTER_PATH_PATTERN is correct for your site/configuration
  warnings.warn(msg)

Xarray#
If you’re familiar with using Xarray with NetCDF data it’s possible to convert an Iris cube to an Xarray DataArray. Both libraries can do similar things but their interfaces are quite different. You may find it simpler to work with one or the other.
https://docs.xarray.dev/en/latest/index.html
https://docs.xarray.dev/en/latest/generated/xarray.DataArray.from_iris.html
import xarray

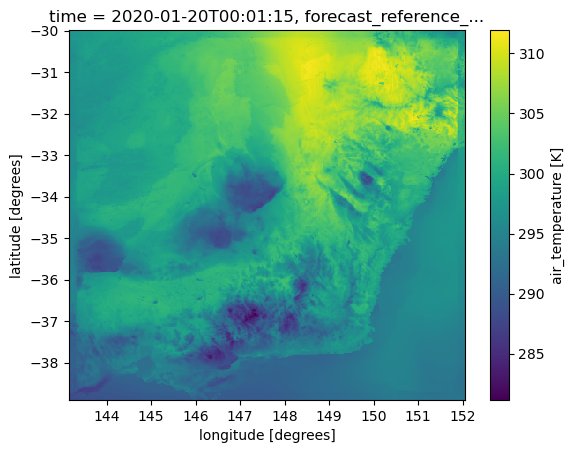
da = xarray.DataArray.from_iris(cube)
da
<xarray.DataArray 'air_temperature' (time: 7, latitude: 450, longitude: 450)>
dask.array<filled, shape=(7, 450, 450), dtype=float32, chunksize=(1, 450, 450), chunktype=numpy.ndarray>
Coordinates:
  * time                     (time) datetime64[ns] 2020-01-20T00:01:15 ... 20...
  * latitude                 (latitude) float32 -38.88 -38.87 ... -30.01 -29.99
  * longitude                (longitude) float32 143.2 143.2 ... 152.0 152.1
    forecast_reference_time  datetime64[ns] ...
    height                   float64 ...
    forecast_period          (time) timedelta64[ns] ...
Attributes:
    standard_name:  air_temperature
    units:          K
    source:         Data from Met Office Unified Model
    um_version:     12.2
STASH: m01s03i236da[0,:,:].plot();

Exercise#
Make a plot from the output data
