Evaluating the Model#
The Regional Evaluation Suite can compare a regional run against observations.
Suite u-cy820 has been set up to evaluate our sample regional run. Check out the suite with rosie checkout and open it in rose edit. Make sure to set the SITE to nci in ‘General Run Options’.
General Options#
PLOT_DIR: Plot output directory
WEB_DIR: Website output directory
NUM_MODELS: How many models to compare
Cycling Options#
TRIAL_DATES: Start and end date of evaluation
Control/Trial model details#
data_host: Set to
gadidata_dir: RNS output directory
data_files: Set to
['umqvaa_pvera%N', 'umqvaa_pverb%N', 'umqvaa_pverc%N', 'umqvaa_pverd%N']data_format: Set to
Fieldsfile
Viewing output#
Go to the website output directory and launch a web server with python
python3 -m http.server
Right click on the link (looks like http://0.0.0.0:8000) and select ‘Open Link’
NCI are looking at how to make these visible in a web browser outside of ARE
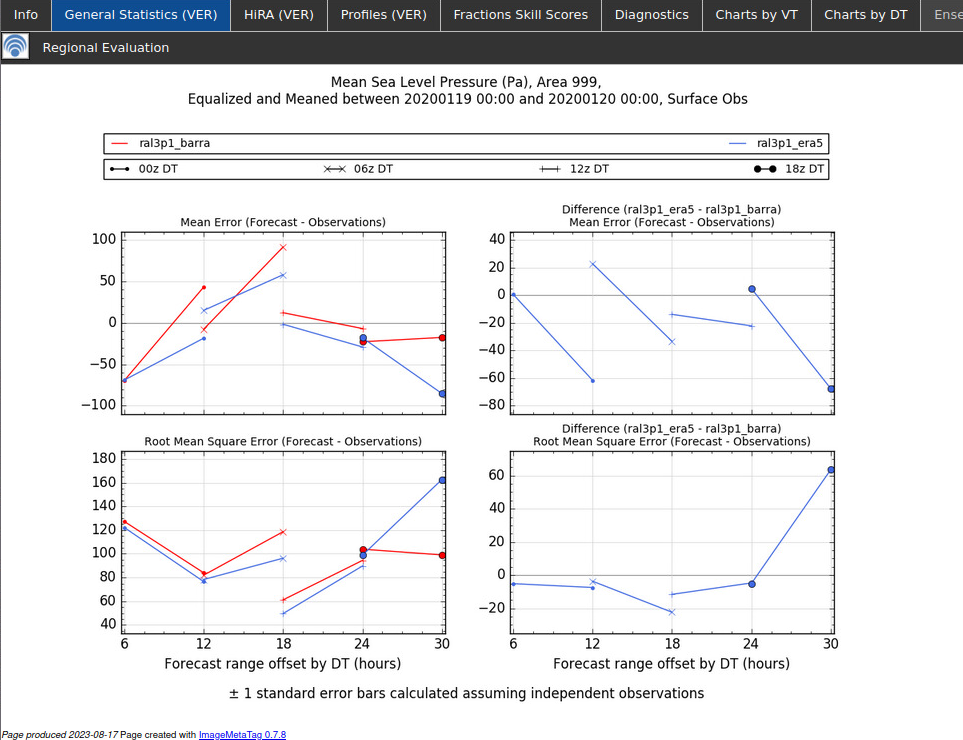
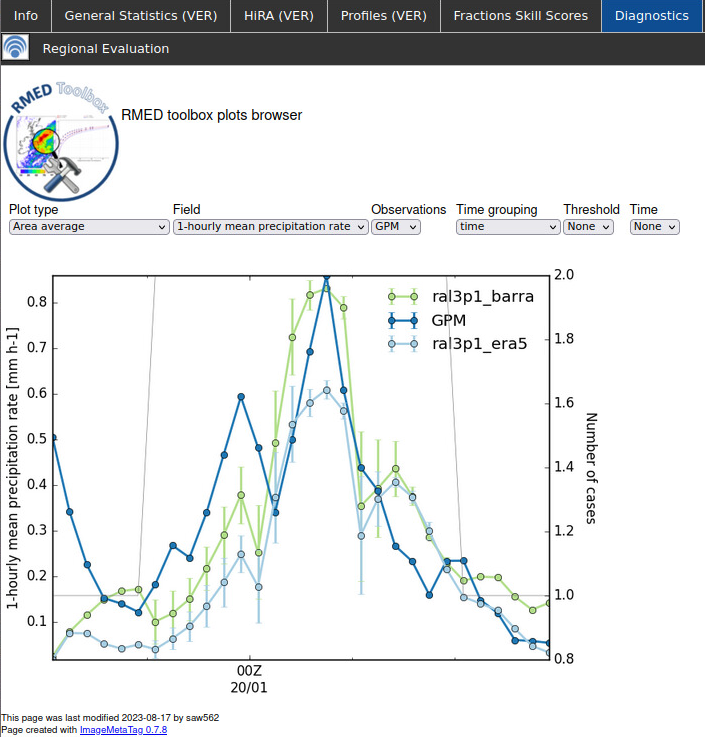
Exercise#
I’ve run two runs of our target domain, the first driving the RNS with BARRA data and the second with ERA5. The website directory is /scratch/nf33/saw562/nri-workshop-tutorial/web. Open the website and explore the differences between the two models and observations.